Following several months of dramatic sales declines and significantly reduced inventory, housing markets in Connecticut, Westchester County, New York, and the Berkshires, Massachusetts experienced notable improvements in October.
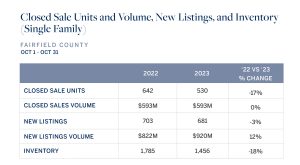
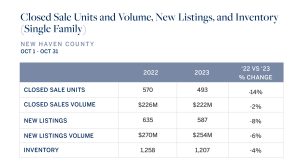
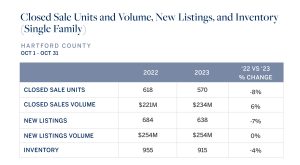
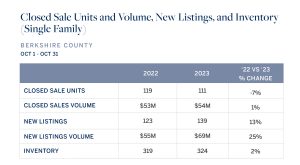
Closed dollar volume was either close to flat or ahead of the same month last year in a number of counties. Our company’s third quarter market report found that from January through September, closed volume in Fairfield was off by 20%, but in October volume was flat with the same month last year, representing a major turnaround after a prolonged period of great declines. The Connecticut Shoreline counties of New Haven, Middlesex and New London saw very small single digit volume decreases versus October 2022, representing a stark contrast with our findings at the end of the third quarter, where year to date volume decreases ranged from 15 to 21%. Hartford County and Berkshire County, Massachusetts, saw volume inch ahead of the same month last year, whereas both counties declined in volume by 18% for the first nine months of the year versus the same time in 2022.


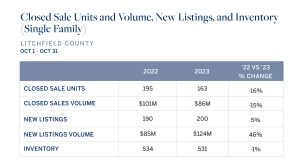
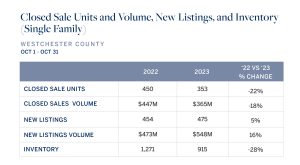
Only Litchfield County, Connecticut, and Westchester County, New York, continued to experience double digit percentage declines month over month, but the declines were smaller than they were at the end of the third quarter. At that time, year to date decreases in Westchester were 25% versus the first three quarters of 2022, but in October volume was down by 18% versus the same month last year. In Litchfield County, year to date decreases through September stood at 24%, yet in October volume was only down 15% versus the same month in 2022.
Severely limited inventory has posed one of the greatest challenges in our markets for multiple consecutive quarters, but those numbers too began to shift in October. While overall inventory levels remained constrained in all territories, new listings taken for the month compared to the same month last year increased in some markets, and the total dollar volume of new listings taken rose in almost every market.
We foresaw improvement in the market in our report last quarter, noting that per our own company’s data pending contracts in many areas increased versus the third quarter the prior year. There were additional positive indicators at the time as well. For a complete analysis please read our third quarter Market Watch here.
The accompanying charts provide a full review of the October data for all market areas, comparing October 2023 to the same month in 2022, sourced from various MLSs.